NEWS
Directional Wave Spectra Drifter Array Measures Massive Waves on Hurricane Ian’s Approach
By Martha Schönau, Luca Centurioni, Steve Jayne, and Elizabeth Sanabia
The NOPP T3A team (Drs. Centurioni and Schönau at Scripps Institution of Oceanography, Dr. Sanabia at the U.S. Naval Academy, and Dr. Jayne at Woods Hole Oceanographic Institution), together with Dr. Shay’s group at the University of Miami’s Rosenstiel School of Marine and Atmospheric Science, deployed an array of drifters, sensors, and a profiler off the east and west coasts of Florida, capturing the extreme waves and winds during Hurricane Ian. The team is very grateful to the Naval Research Laboratory (NRL) VX P3 squadron, the USAFR 53rd Weather Reconnaissance squadron, and Timberview Helicopters for facilitating the deployment of the sensor array.
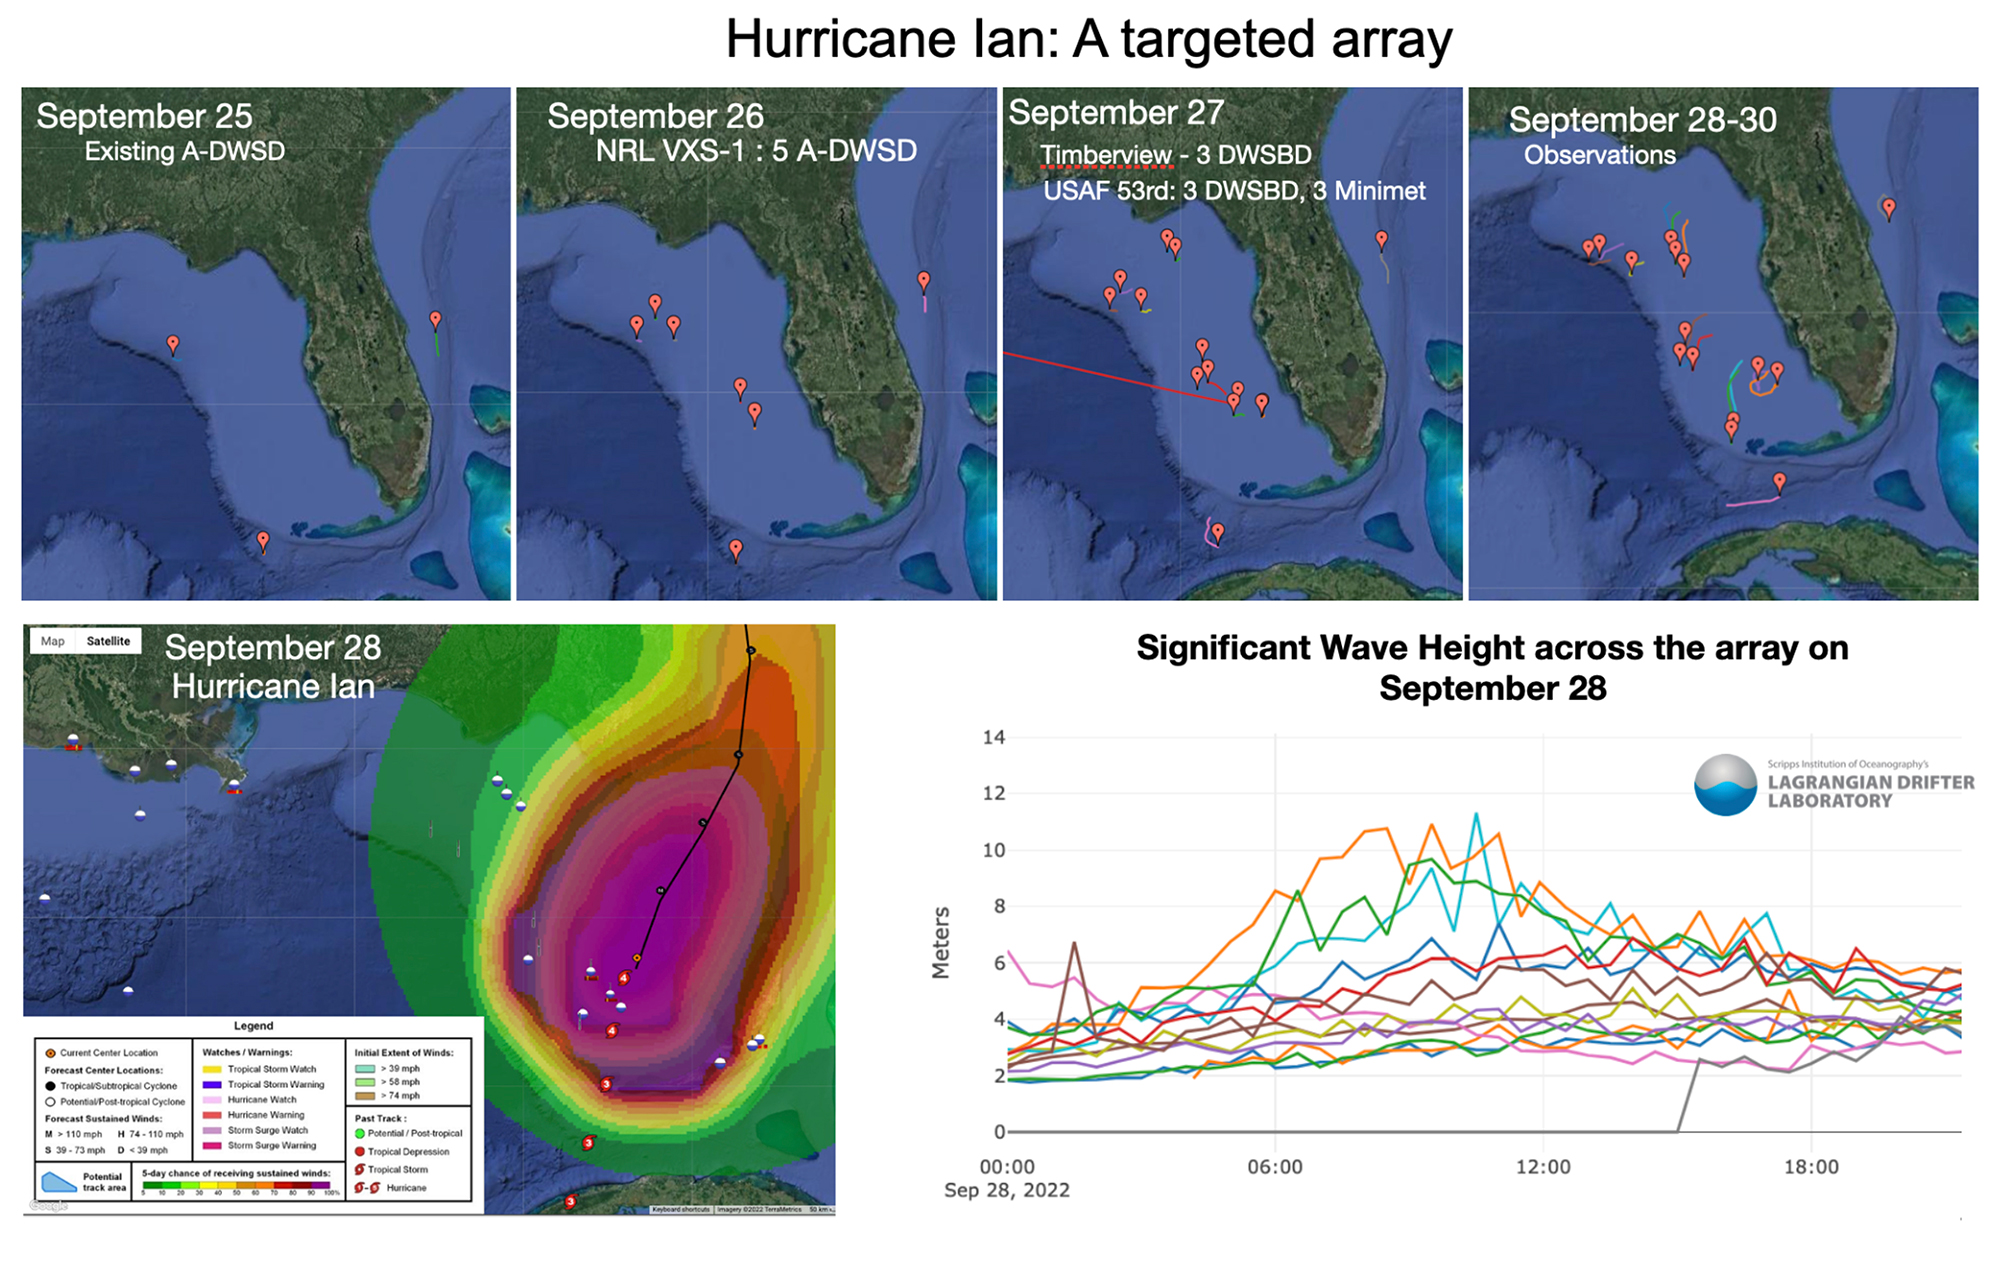
Beginning in May 2022, Dr. Schönau worked with colleagues and deployment partners to establish an array of Lagrangian Drifter Laboratory (LDL) Directional Wave Spectra Barometer Drifters (DWSBD), Directional Wave Spectra Drifters (DWSD), SVP Barometer (SVPB) drifters, and SVP drifters to monitor hurricane development. As Tropical Storm (later Hurricane) Ian transited through the Caribbean Sea, the team started working on the targeted deployments for the West Florida Shelf, ahead of the storm. First indications of the severity of this storm came from the A-sized DWSD (A-Sized DWSDs fit through the deployment chutes on P3 and C130 airplanes) in the Florida Straits. As the storm passed over the drifters, waves with significant wave height over 8 m (24 ft) were measured by Drifter 300534061497470, where significant wave height is the mean height of the highest third of the waves. On Monday, September 26, The NRL VXS-1 squadron deployed five A-DWSDs in a line bisecting the storm’s projected path, with the assistance of Jake Davis, a graduate student at University of Washington, and in collaboration with National Oceanographic Partnership Program (NOPP) partners (Figure 1). These drifters were targeted to observe hurricane storm surge. Following the NRL deployment, on Tuesday, Drs. Sanabia and Jayne deployed LDL MiniMet drifters and DWSBDs in the core of the storm in addition to one of their wave measuring profiling ALAMO floats. All wave drifters successfully began reporting data in near-real time to the Global Telecommunication System (GTS), and continue to do so. The array was supplemented by additional DWSBDs along the northern boundary to capture a full scene data set of waves and storm surge potential.
FIGURE 1. Hurricane Ian was targeted for instrumentation with air-deployable wave, wind, sea level pressure, and temperature drifters. Top row, from left to right: Existing drifters on September 25, 2020; the array following deployment by NRL VXS-1 on September 26; the array after drifters were deployed by USAF 53rd and Timberview on September 27; and drifter trajectories during and following Hurricane Ian’s passage. Bottom left: Drifter locations on September 28, with expected winds from the National Hurricane Center (NHC). Bottom right: Significant wave height observations by the drifter array during Ian’s passage.
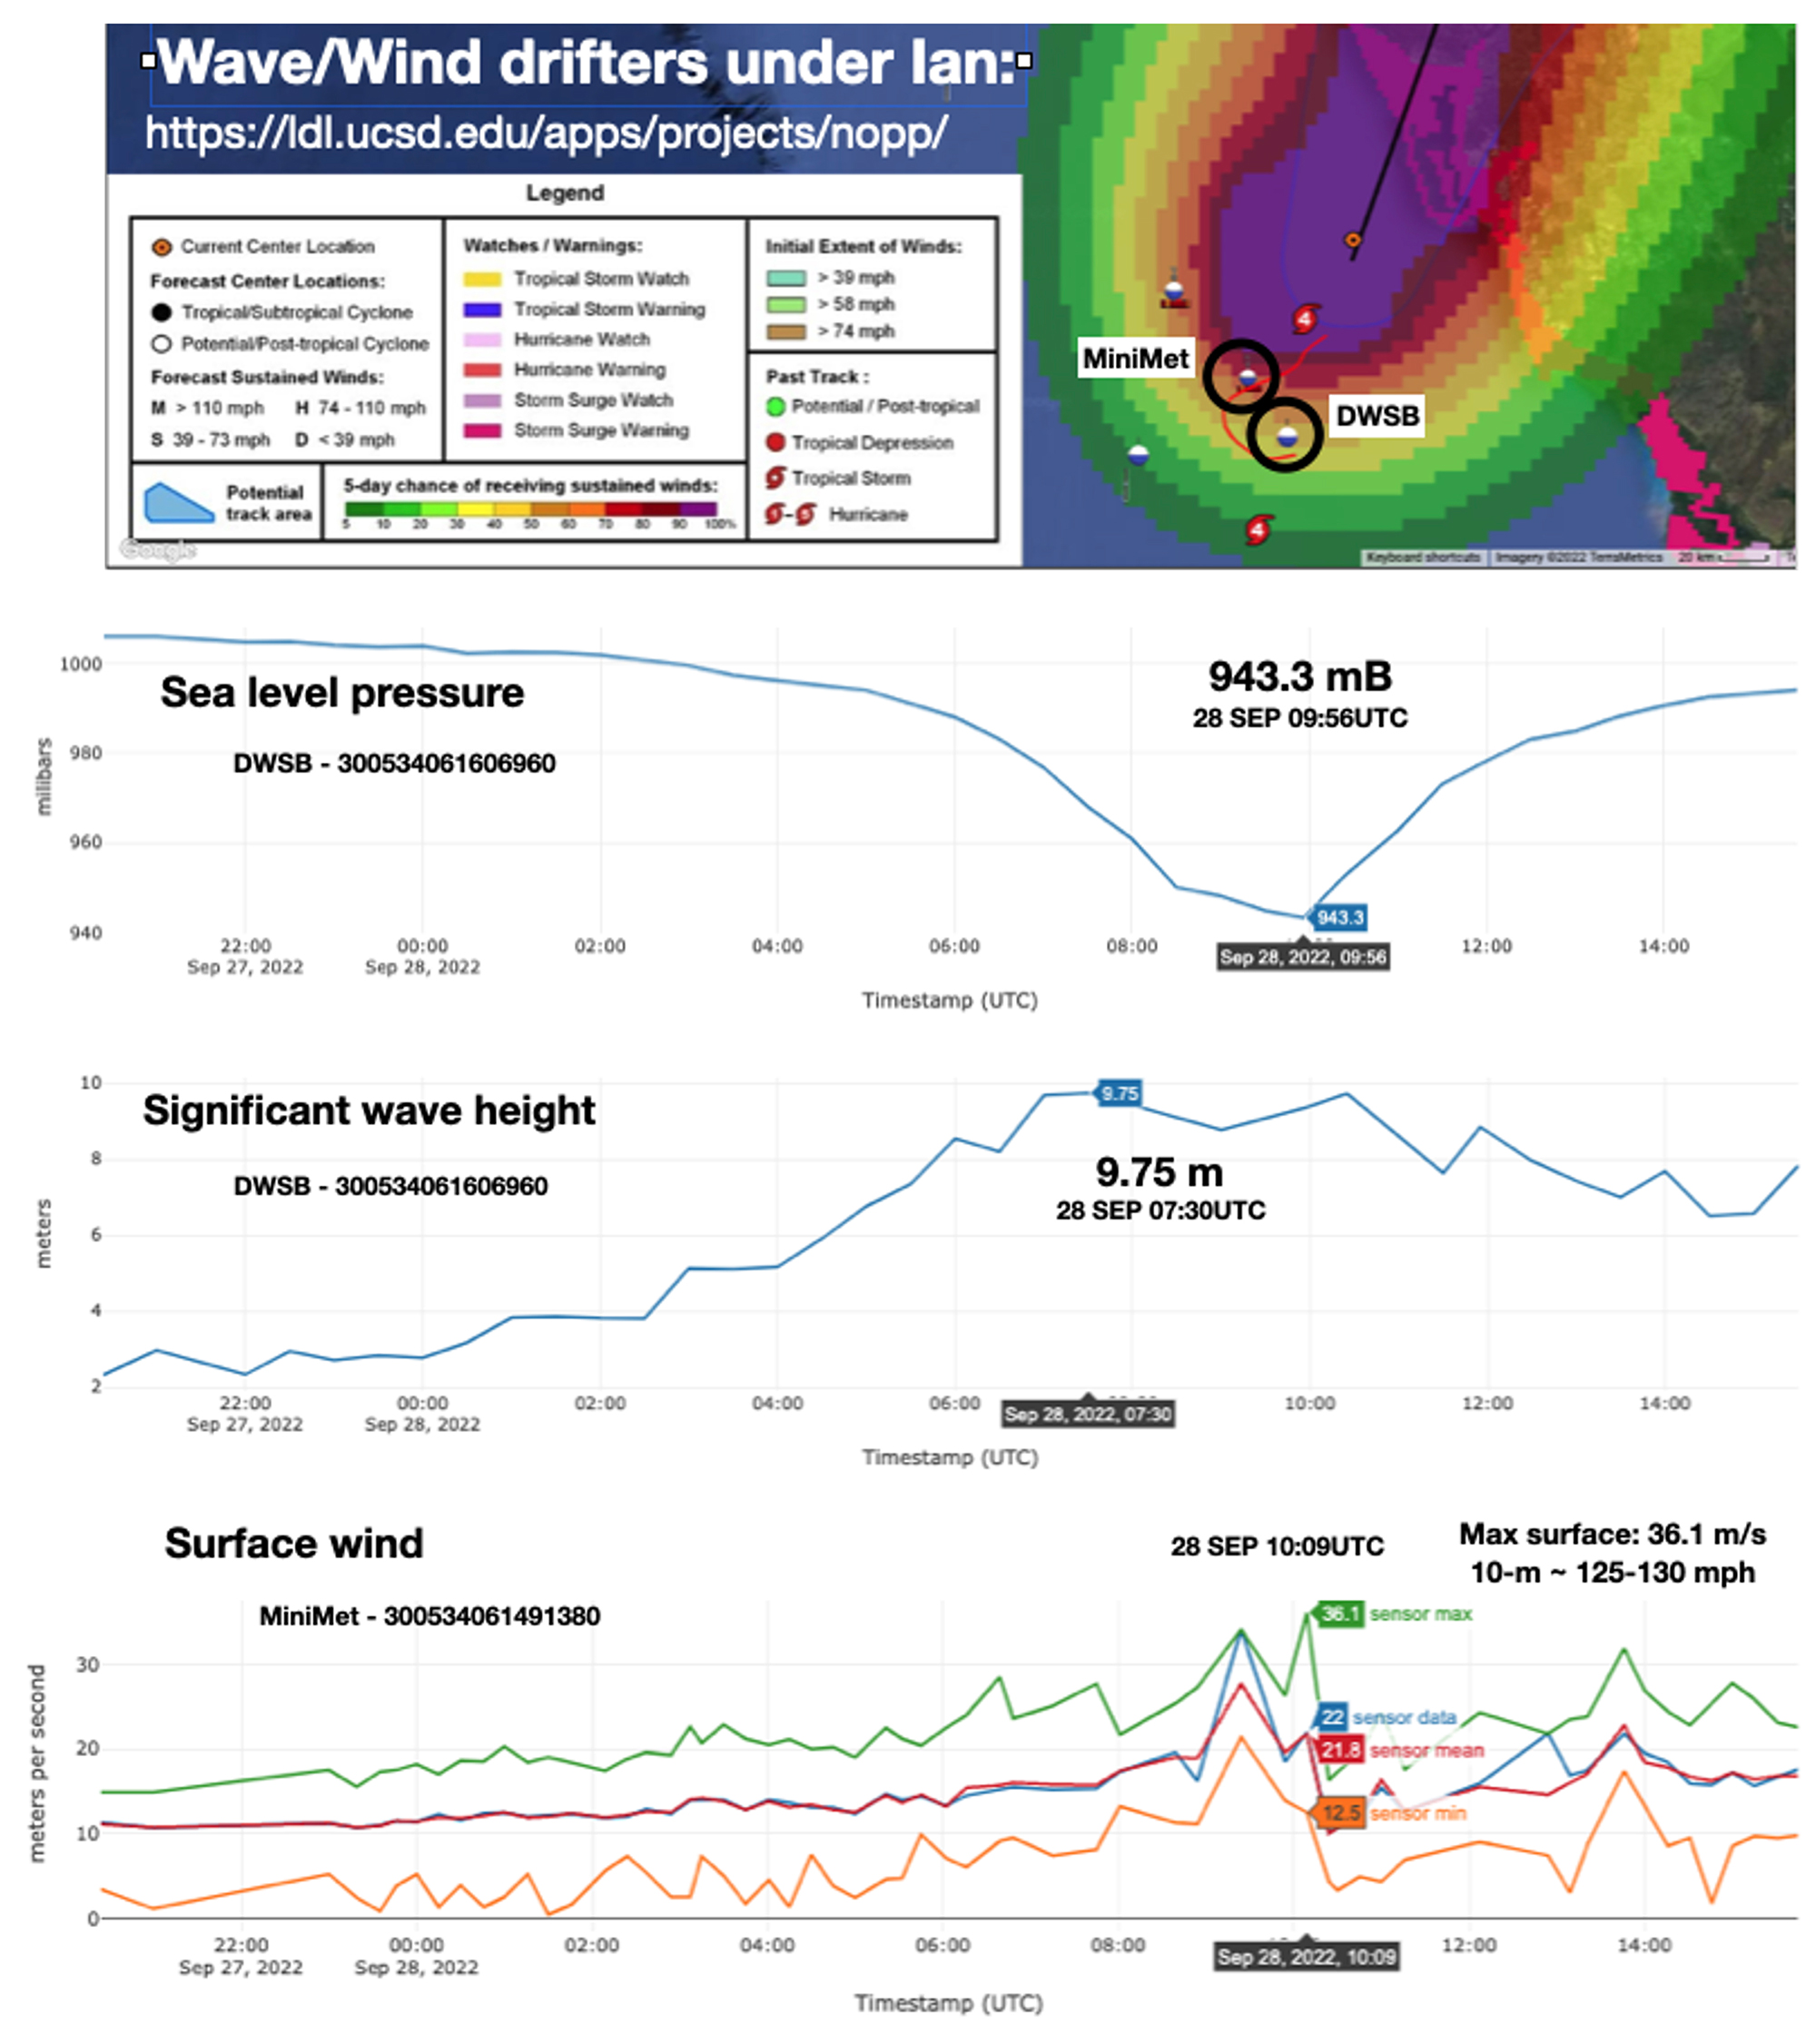
A maximum surface wind speed of 36.1 m s–1 was recorded as the right quadrant of now Hurricane Ian passed over before landfall (Figure 2). Large waves (significant wave height over 11 m) north, west, and directly under the storm center were recorded as the storm approached and passed. A minimum sea level pressure (SLP) of 943.3 mbar and waves greater than 11 m (36 ft) were observed by Drifter 300534061605930 near the eye passage (Figure 2). As the storm moved over Florida and out to sea again, the eye passed over Drifter 300534061550900 offshore of Daytona, Florida, which observed significant wave heights greater than 6 m (20 ft).
All of the LDL wave drifters are continuing to send data to monitor the conditions in the Gulf of Mexico. Power management options allow these drifters to be ready for observations of the next tropical storm. This extensive data set will be used to validate storm surge and wave models, better characterize the air-wave-ocean momentum transfer, and provide lessons for establishing and maintaining such a sensor array.


