![]()
NEWS
Drifters Deployed in Anticipation of Hurricane Isaias (August 2020)
The 53rd Weather Reconnaissance Squadron dropped four drifter packages ahead Hurricane Isaias on the evening of August 3, 2020, on the continental shelf off Charleston, South Carolina.
The first three drifter packages contained a Directional Wave Spectra Drifter (DWSD), denoted by the yellow icon in Figure 1, and a MiniMet (which measures wind and sea level pressure and velocity), denoted by the green icon (Figure 1). The fourth package contained a Surface Velocity Program Barometer (SVPB) drifter (blue icon) and an additional drifter that did not turn on. All drifters measured sea surface temperature.
The three (yellow/green pairs) stayed close together and formed a picket line across the continental shelf, measuring conditions before the hurricane approached. Figures 2–5 show the progression of conditions—sea level pressure, wind speed and direction, wave height, frequency, and direction, and sea surface temperature. At the time of the passage of the Hurricane’s eye, two drifter pairs (DWSD and MiniMet) were directly “in line,” bisecting the core of the storm.
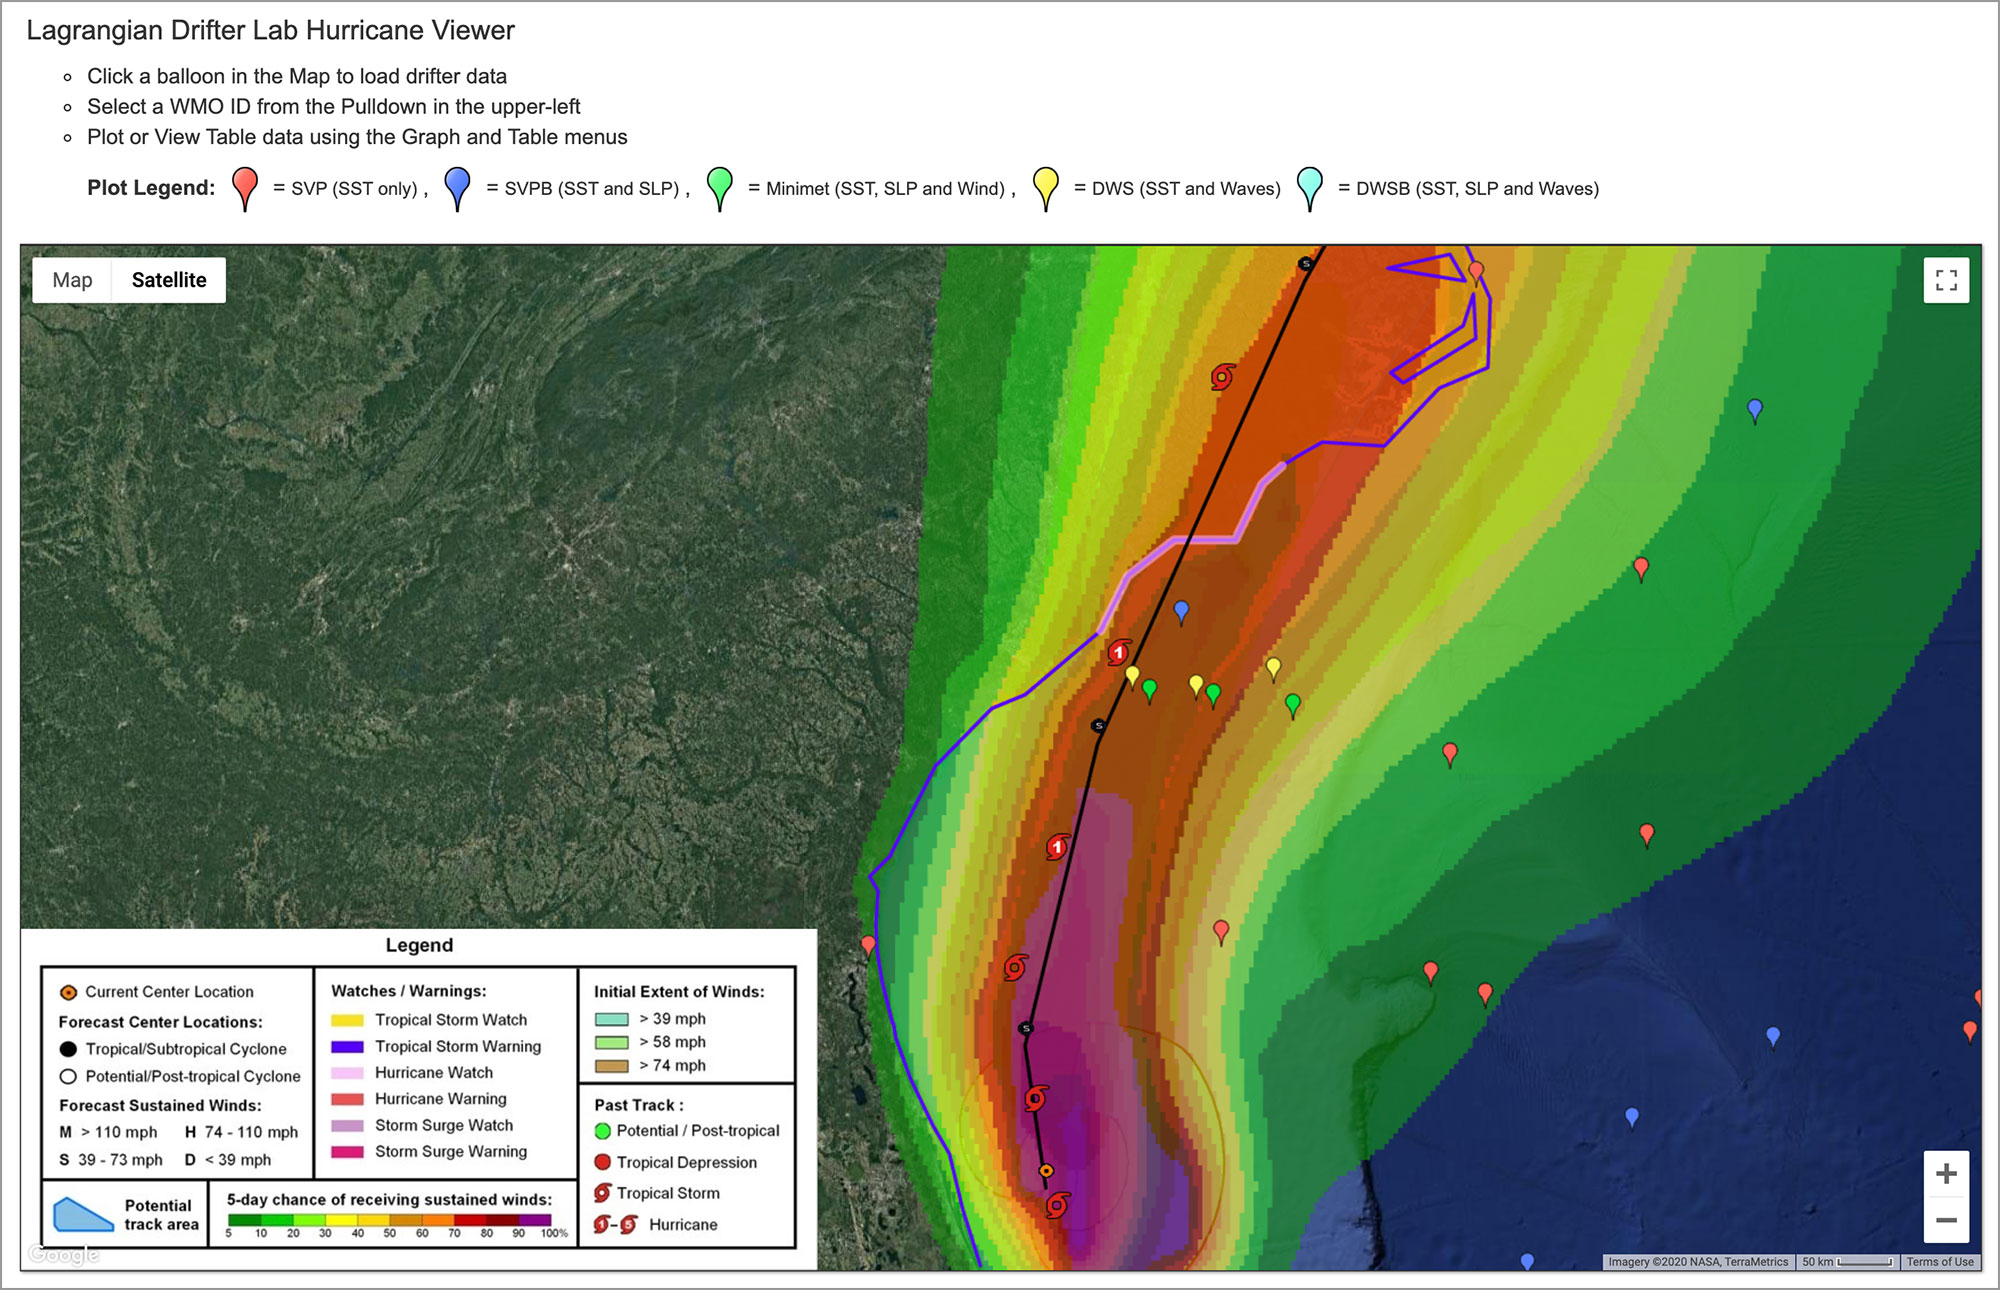
Figure 1. Map showing drifters deployed off the US East Coasts as Hurricane Isaias was approaching the coast of South Carolina. Yellow = Directional Wave Spectra Drifter (DWSD). Green = MiniMet. Blue = Surface Velocity Program Barometer (SVPB) drifter.
The drifters capture the following relevant data to help understand air-sea interactions under the hurricane.
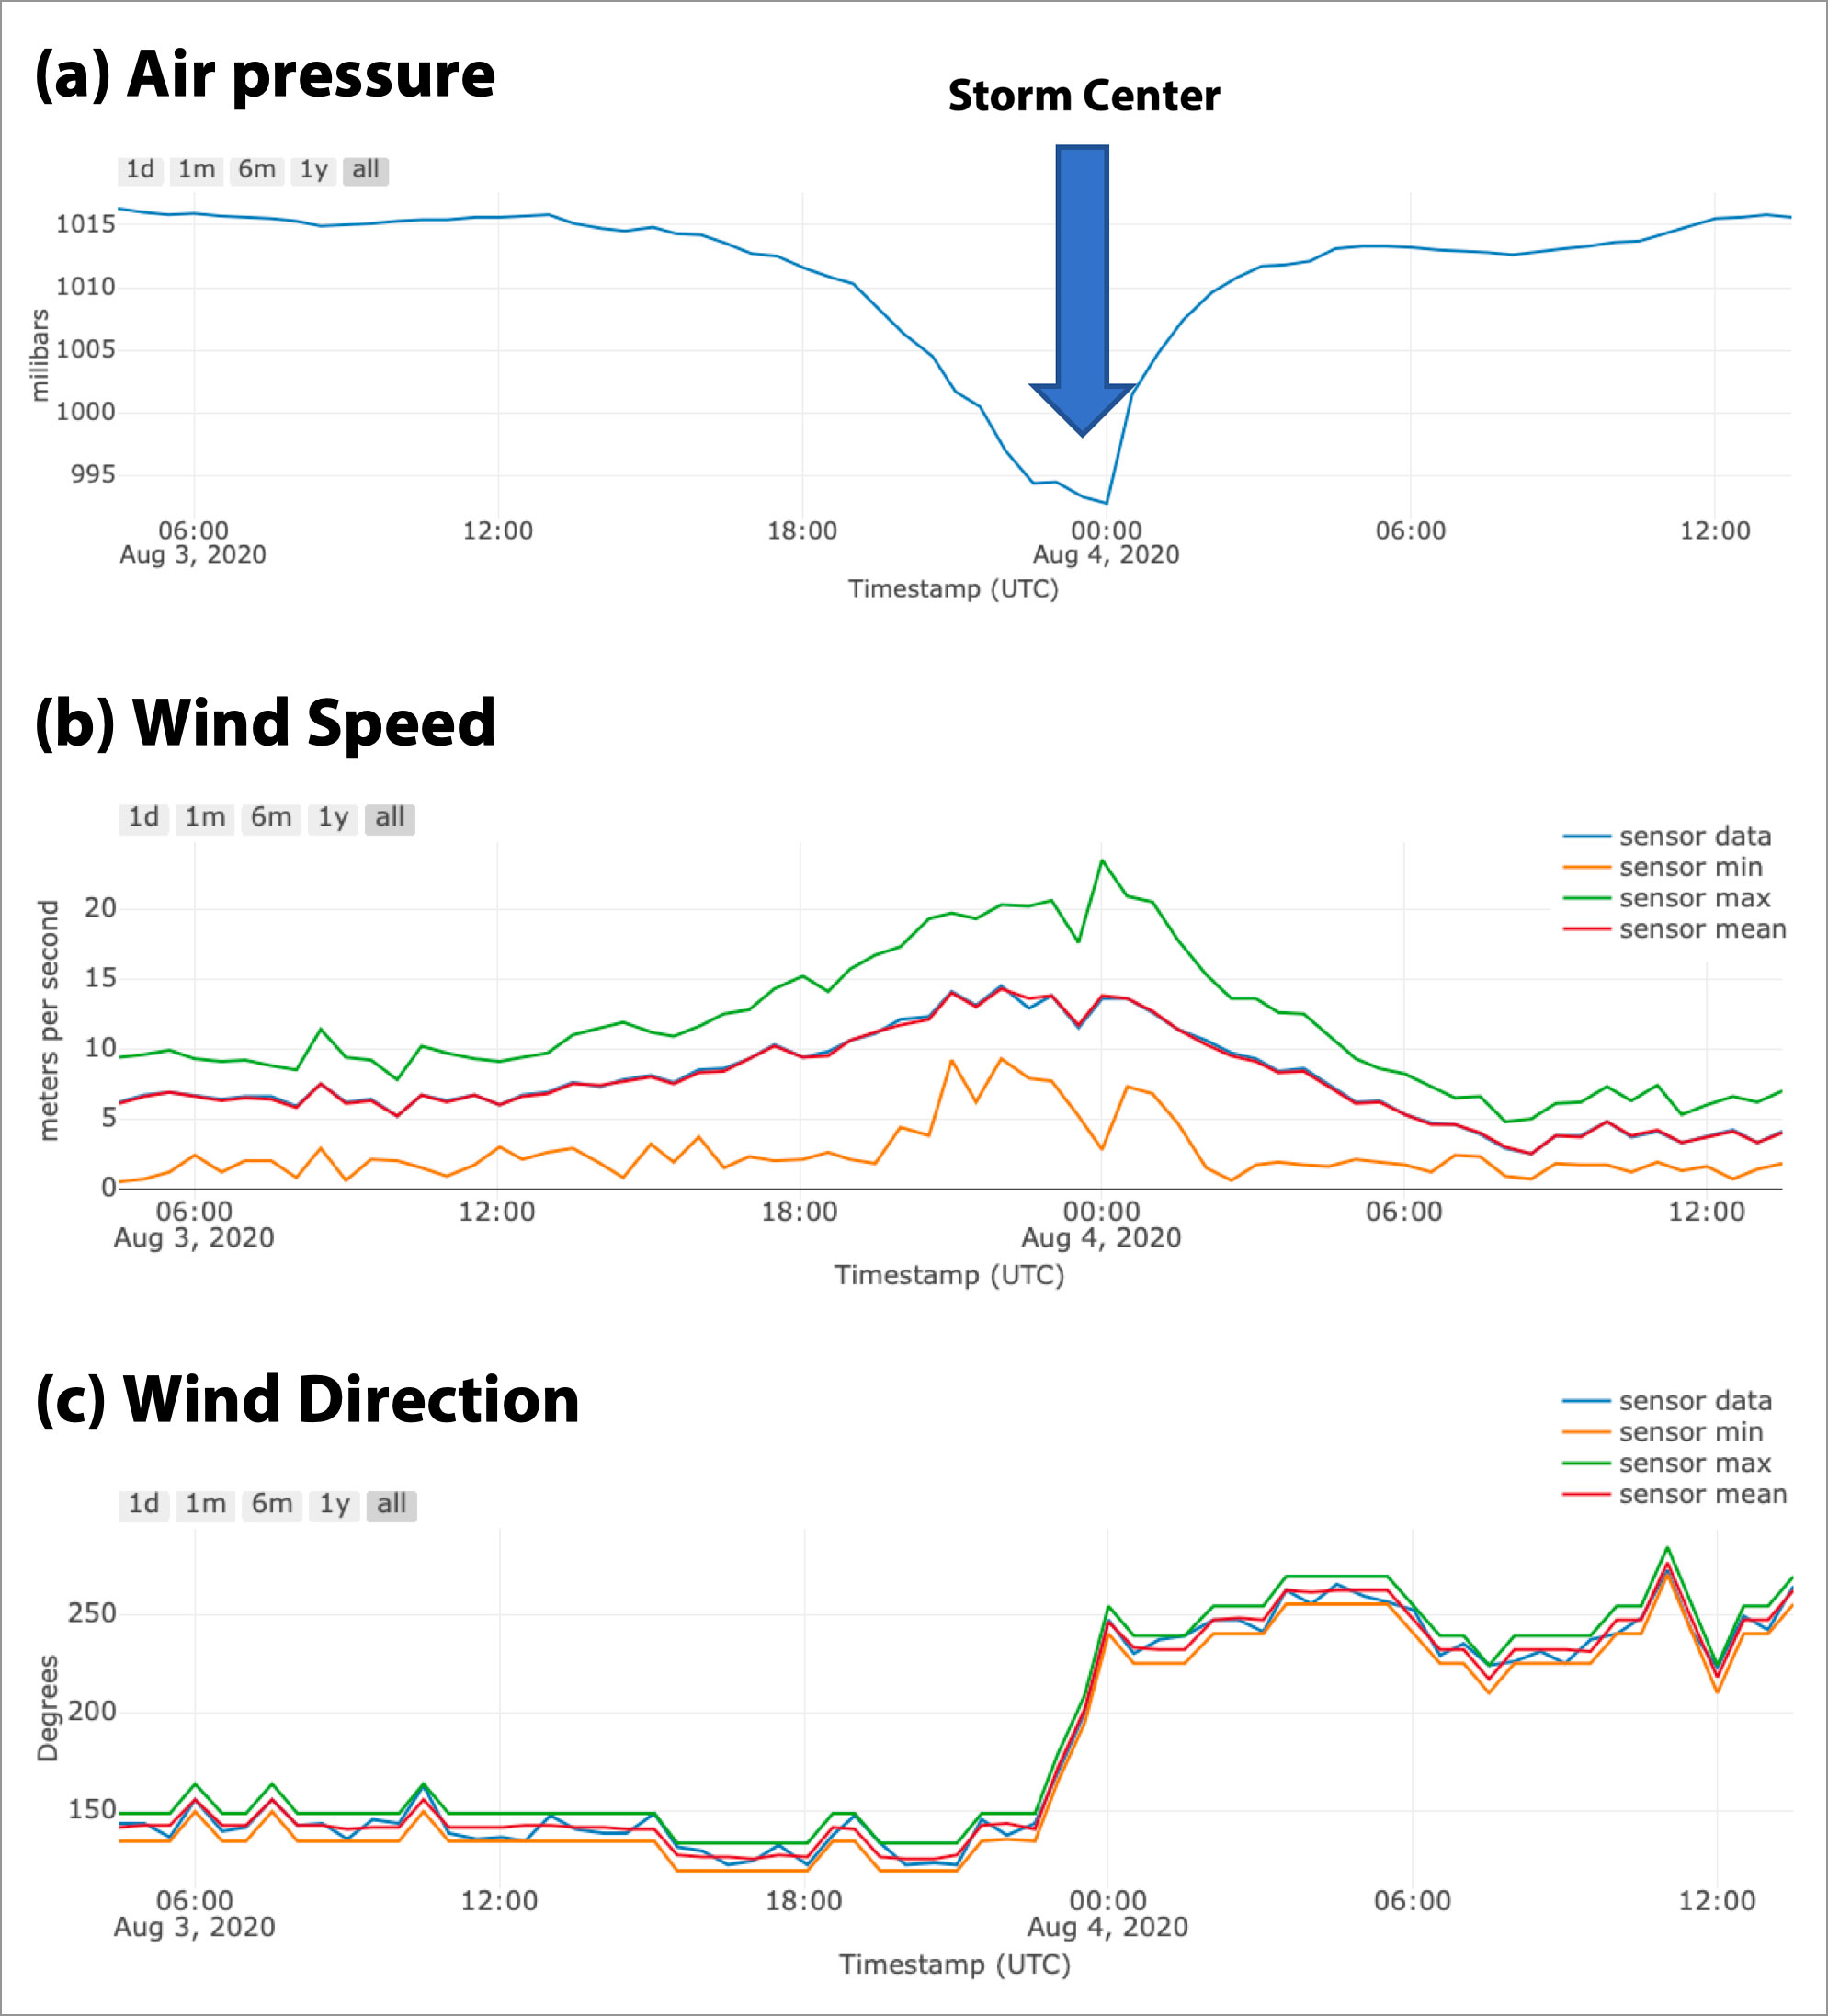
1. The onshore (westerly) wind speed ramped from 10 m/sec to over 20 m/sec over the course of six hours and was sustained for an additional six hours (Figure 2b). The shift from a SSE to westerly wind direction was abrupt and coincided with the passage of the eye (Figure 2c). This information is highly relevant to storm surge modeling.
Figure 2. Data from the inshore MiniMet, probably located to the right-hand side of the hurricane’s eye. (a) Air pressure. (b) Wind speed. Wind speed decayed over six hours after the passage of Hurricane Isaias, nearly sustaining a westerly direction (see panel 2c). (c) Wind direction. The wind shifts from SSE to nearly westerly after passage of the hurricane’s eye.
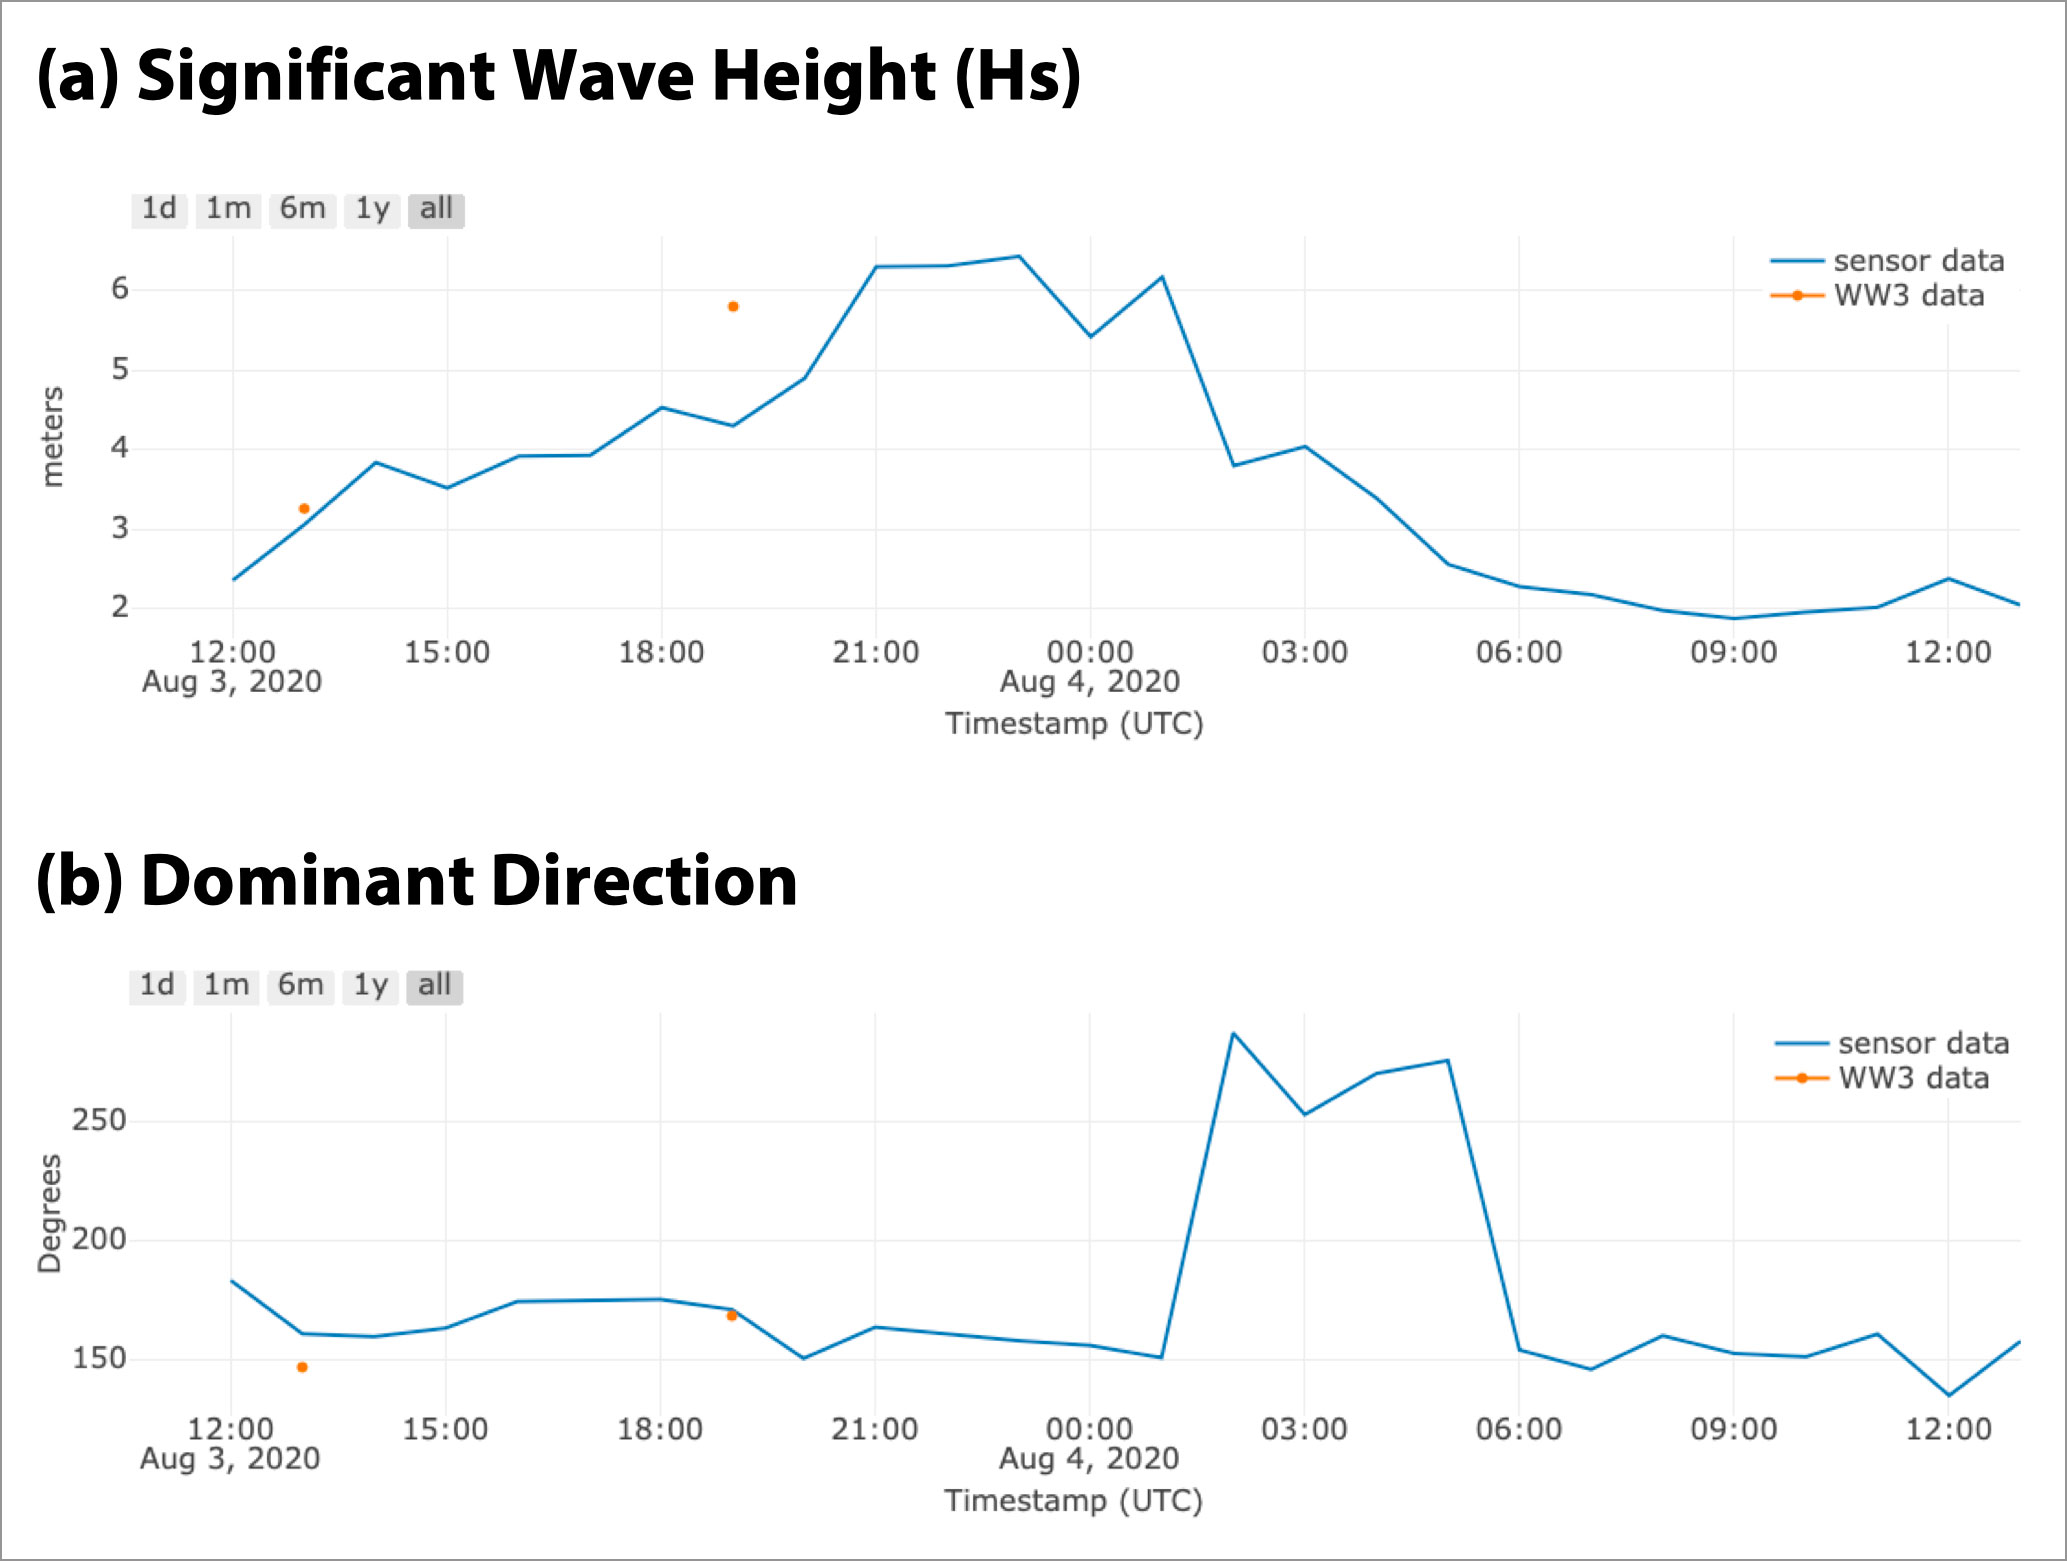
2. The wave drifters measured largest significant wave heights arriving hours before the eye of the storm (Figure 3a). These waves are directed inshore and are highly relevant to storm surge prediction. After passage of the eye of Hurricane Isaias, the dominant direction changes abruptly (Figure 3b).
Figure 3. Data from the Directional Wave Spectra Drifter (DWSD) (closest to MiniMet), probably located to the right-hand side of the hurricane’s eye. (a) Significant wave height. Maximum waves arrive three hours before the storm (swell, 9 s period). (b) Dominant direction. Large waves before the storm arrives are directed inshore (from 150°N, storm surge). After the eye has passed, waves propagate east.
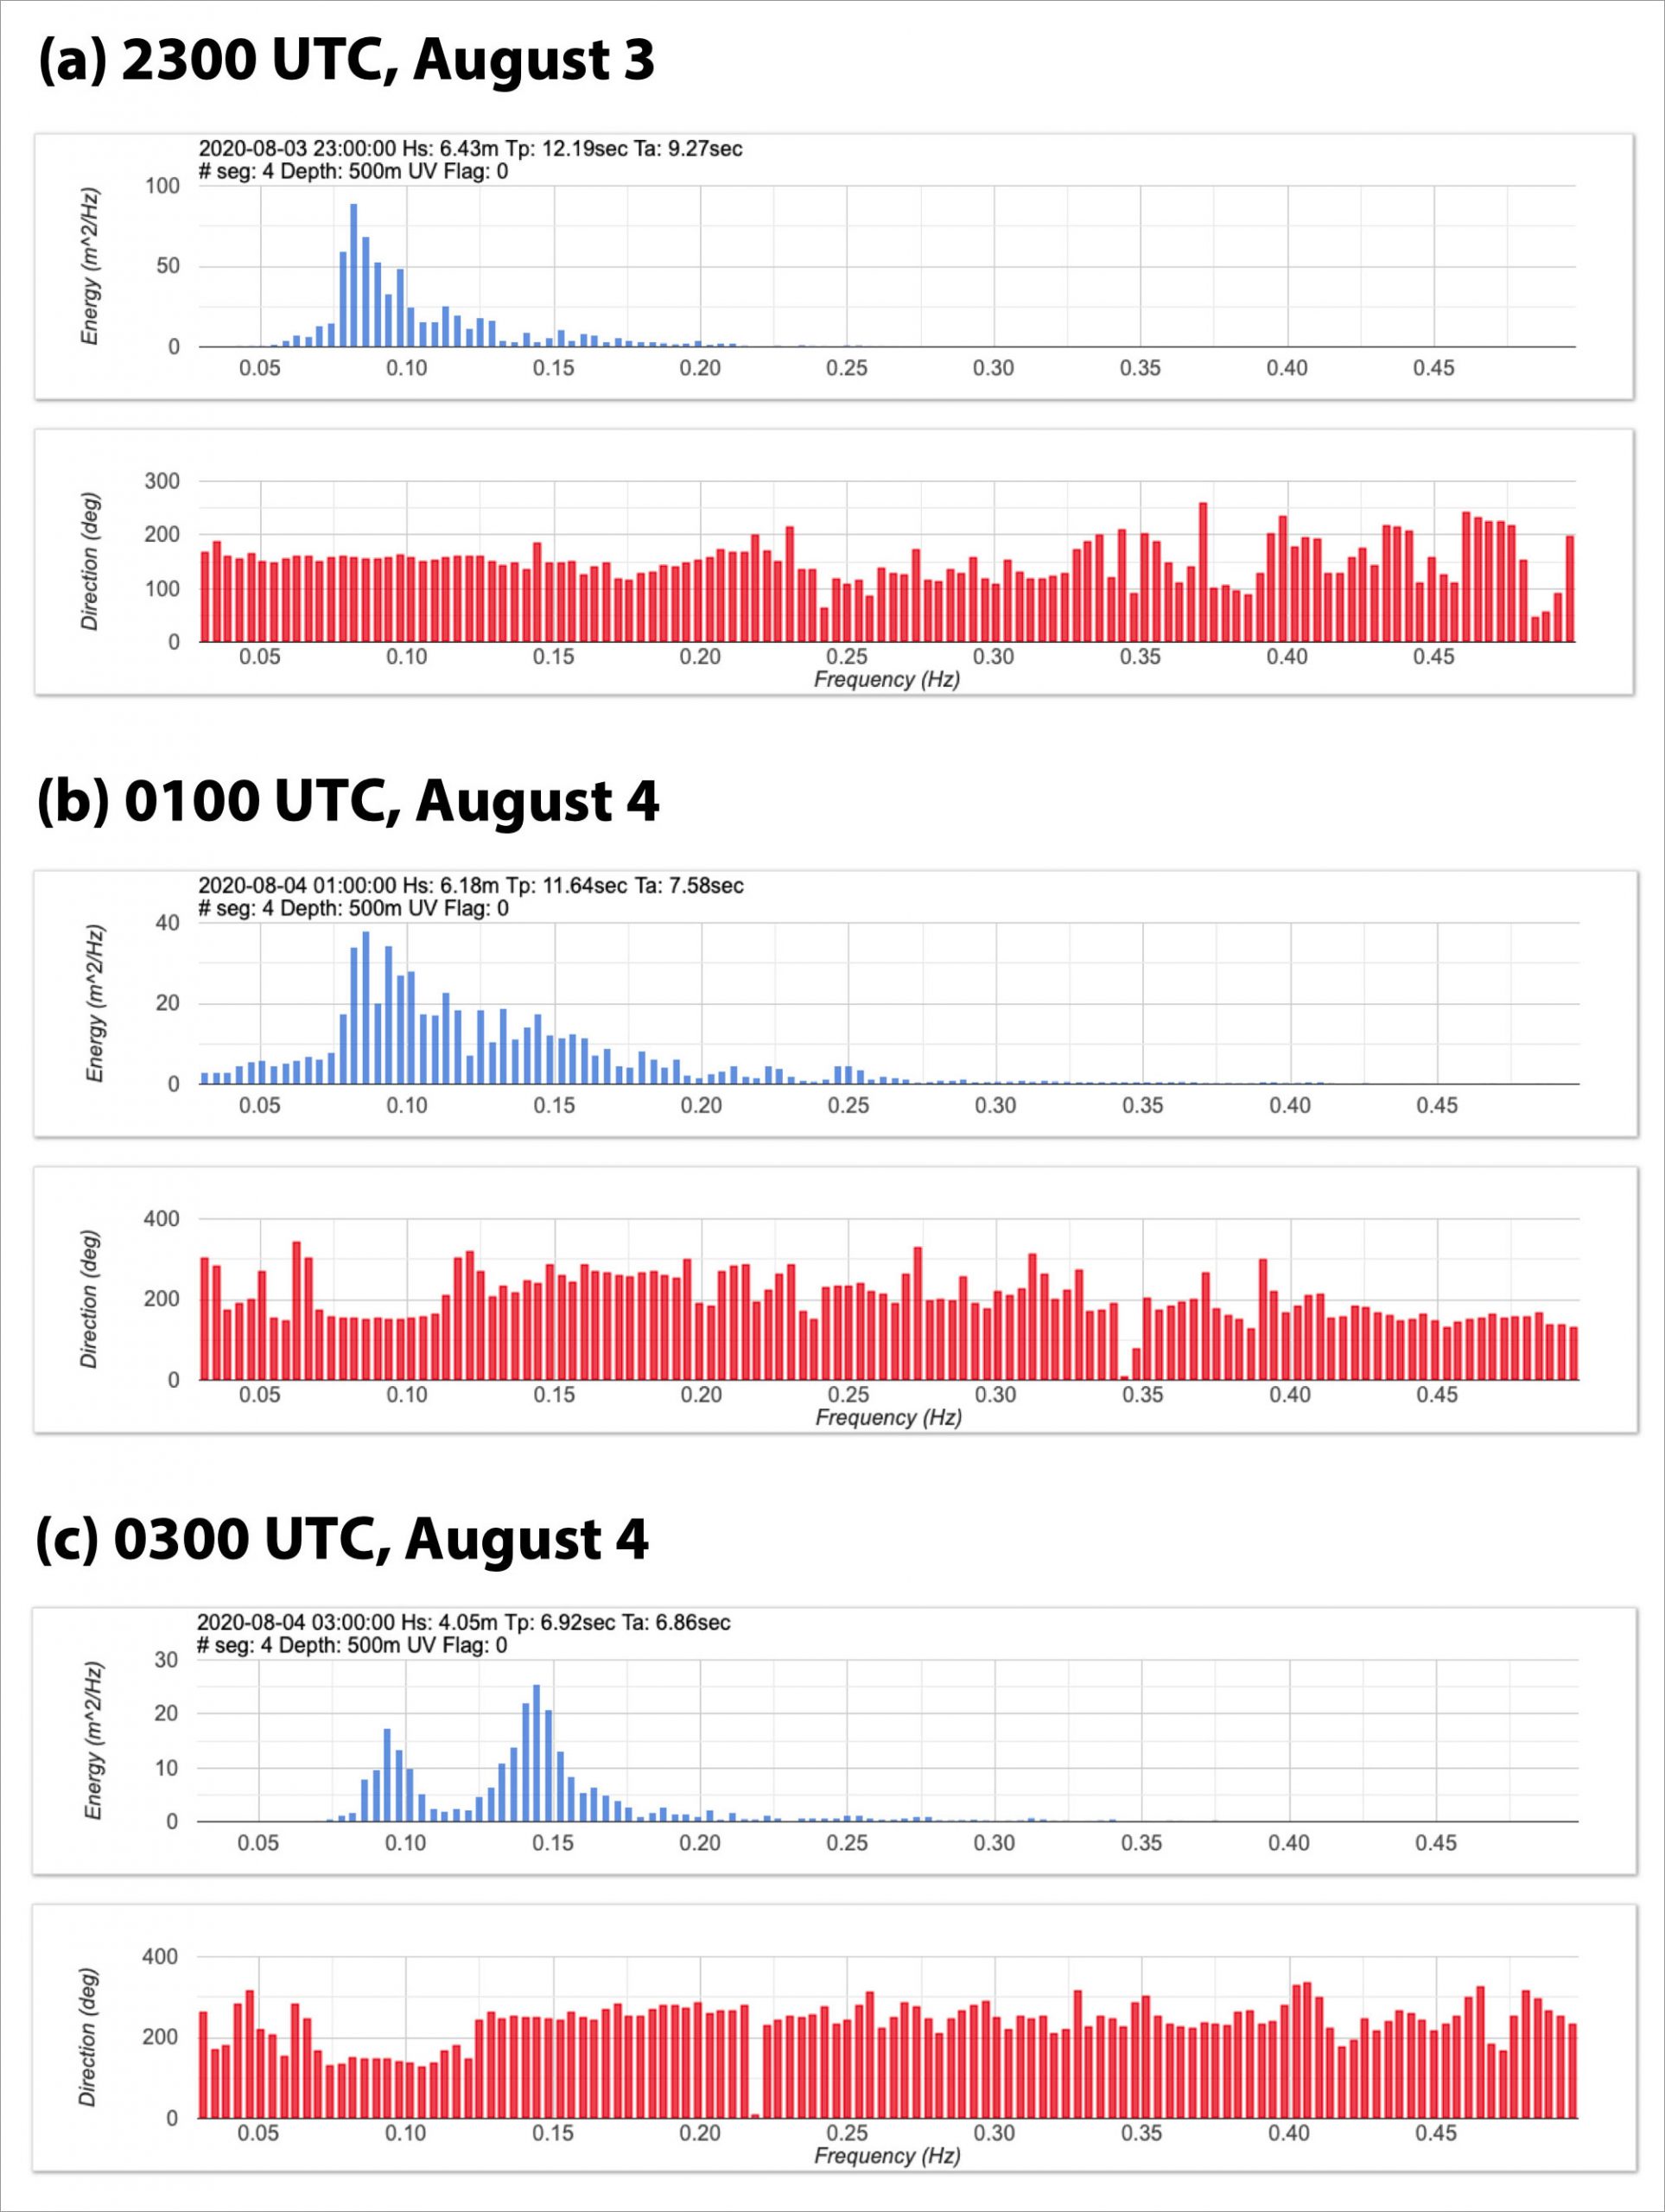
3. The time series of wave spectra (Figure 4) shows the transition of swell and locally generated wind waves under different parts of the hurricane. Normally in a large storm away from the coast, the large swell will move ahead of the storm. Isaias was atypical because of its proximity to land. There are indications of inbound swell even during opposing winds. After the passage of the storm, there is a return to locally generated wind waves.
Figure 4. Data from the Directional Wave Spectra Drifter (DWSD). (a) 2300 UTC, August 3. Pre-arrival of the hurricane’s eye spectra. Storm surge phase. (b) 0100 UTC, August 4. Beneath the hurricane’s eye. (c) 0300 UTC, August 4. The wake of the hurricane. Tp ~6 s, locally generated wind waves.
4. The partition of swell and wind waves is relevant to estimation of the drag coefficient that couples the air-wave-ocean boundaries and the transfer of energy between them and its role in hurricane development and intensification. This information is also relevant to storm surge predictions.
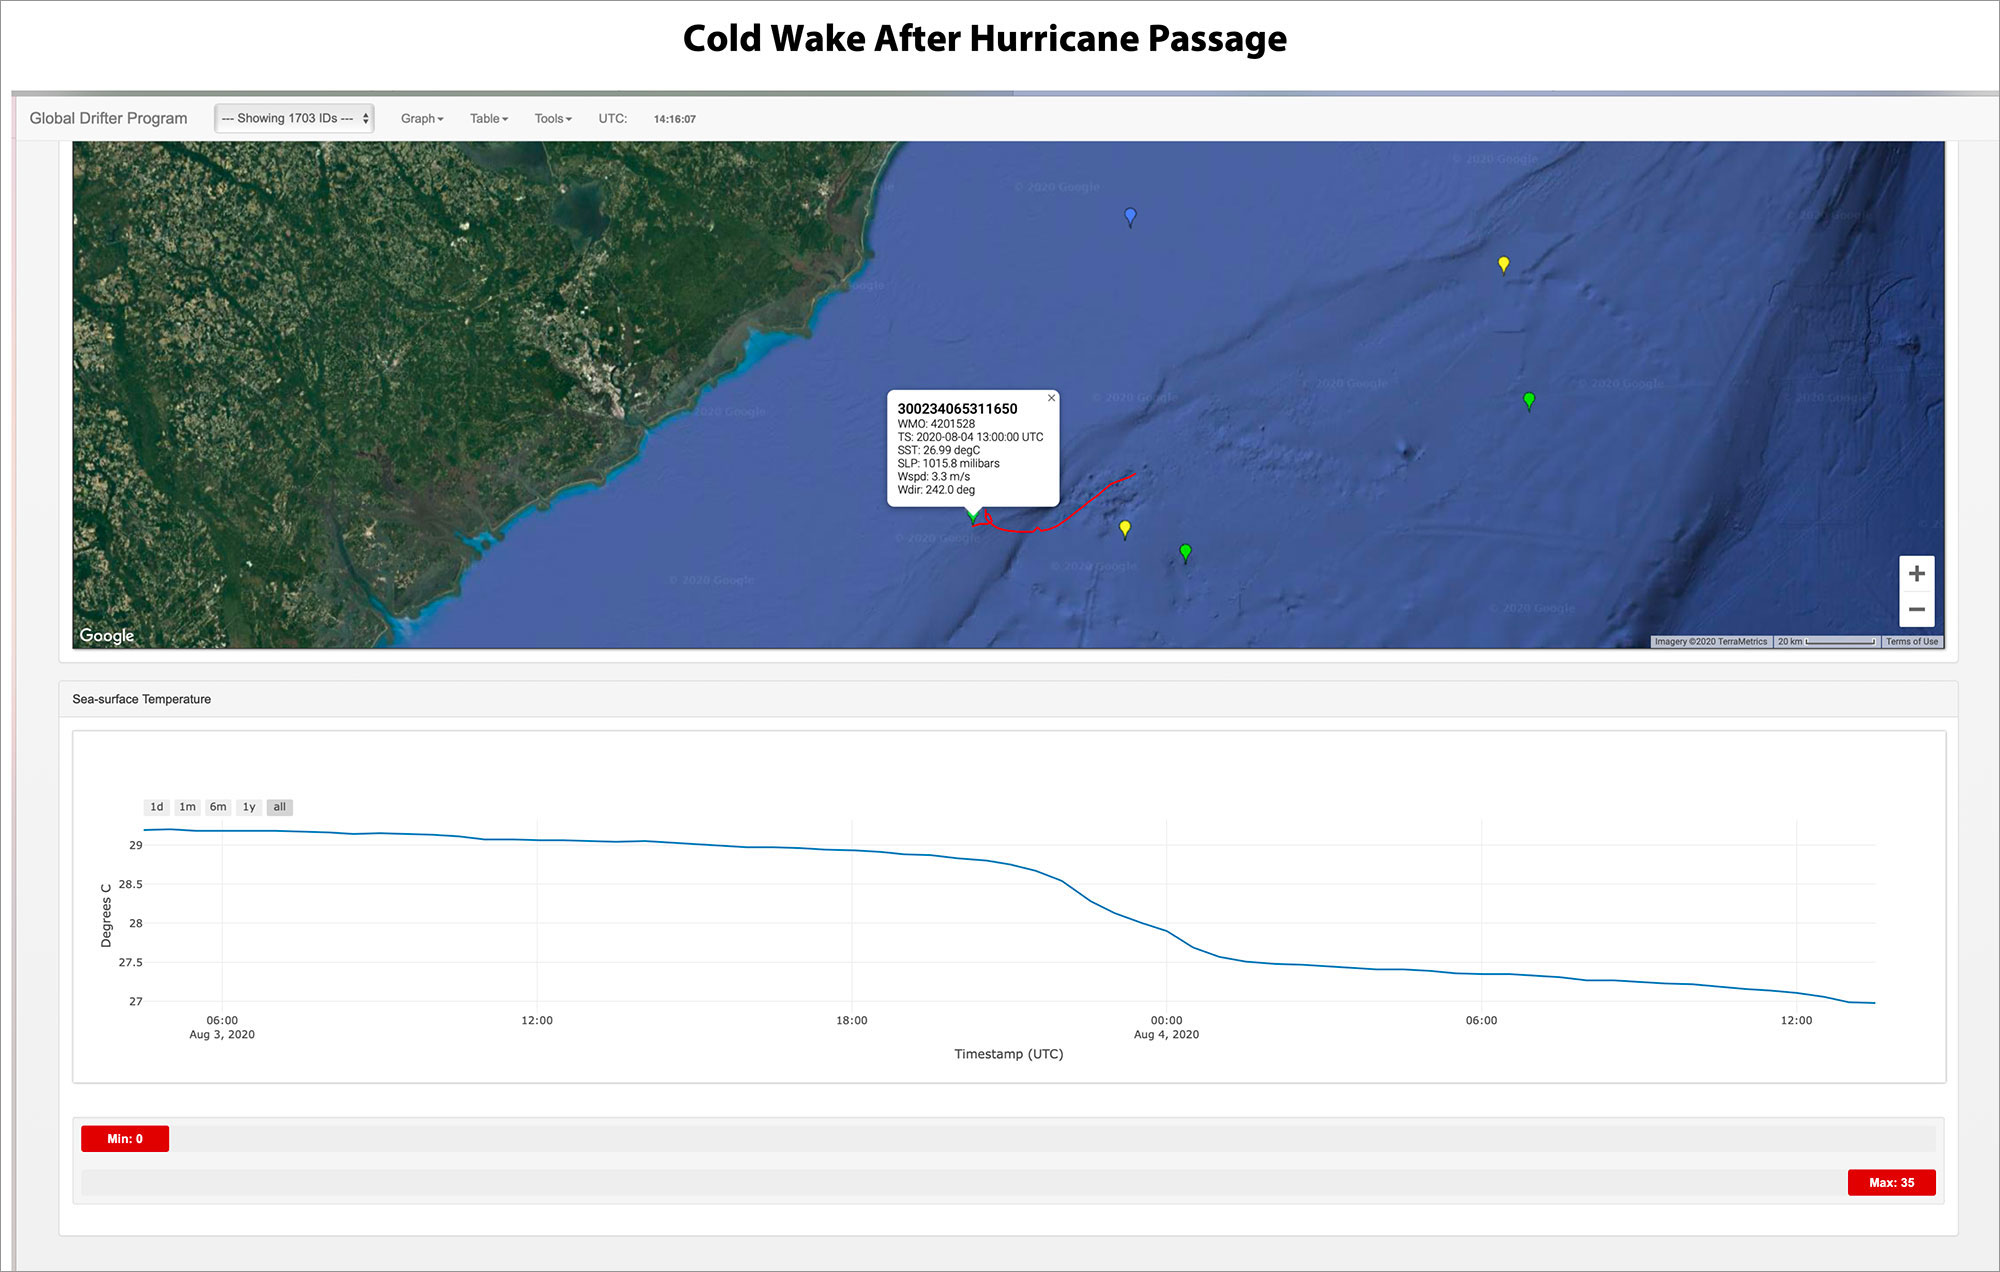
5. The drifters show the high sea surface temperatures that fed Tropical Storm Isaias, allowing it to become a hurricane, and then the 2-degree cooling after its passage (Figure 5). This rapidly cooled water is referred to as a “cold wake,” and research shows that these wakes can influence the strength and direction of storms that follow.
Figure 5. Cold wake after hurricane passage.
These drifters provide a rare and valuable data set for modelers to use in understanding the skill of their forecasts and to use in strategies for future observing-data assimilation support of hurricane forecasting.
Thank you to the 53rd Weather Reconnaissance Squadron and Chief, Aerial Reconnaissance Coordination, All Hurricanes (CARCAH) unit for scheduling and executing the deployment.