NEWS
Global Drifter Program Deploys Wave Drifters Under Hurricane Teddy
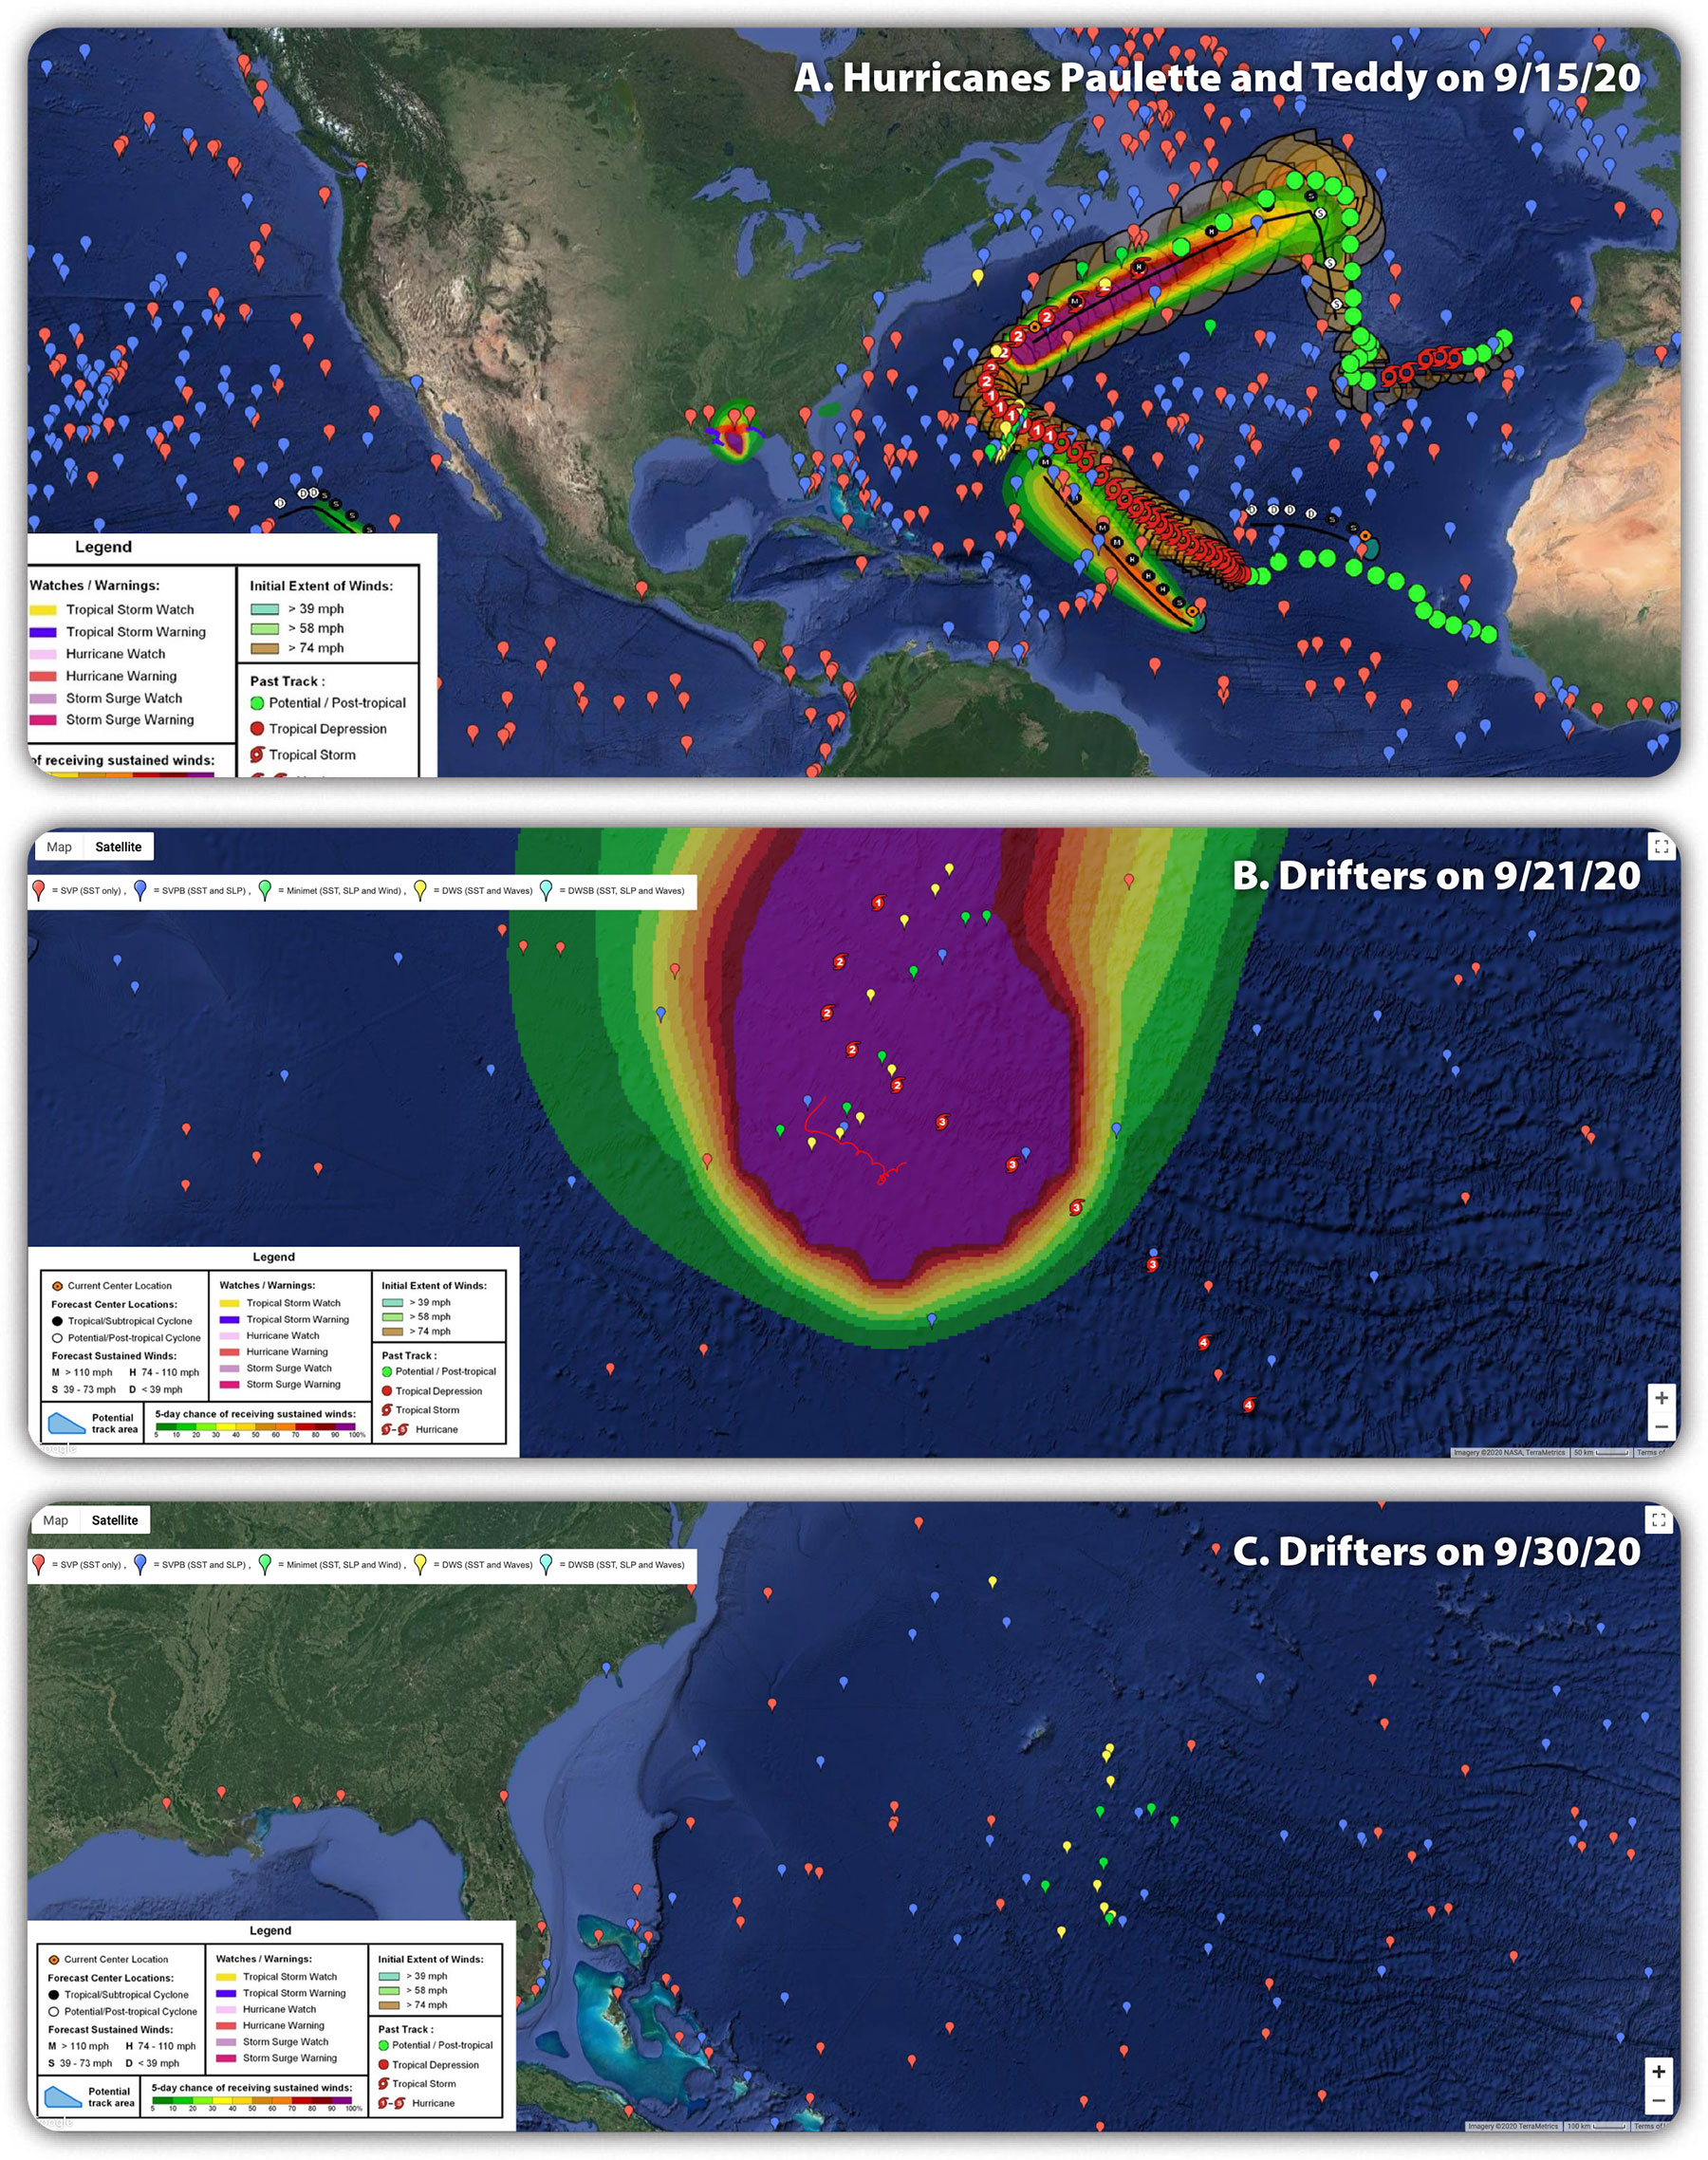
The Global Drifter Program (GDP) worked with the 53rd Weather Reconnaissance Squadron to drop 8 “hurricane buoy packages” on September 20, 2020, ahead of Hurricane Teddy. The hurricane buoy packages contained a Directional Wave Spectra Drifter (DWSD), denoted by the yellow icons in Figure 1, and either a MiniMet which measures wind, sea level pressure, and velocity), denoted by the green icons in Figure 1, or an ADOS (which measures subsurface temperatures to 150 m depth instead of velocity). All drifters measured sea surface temperature.
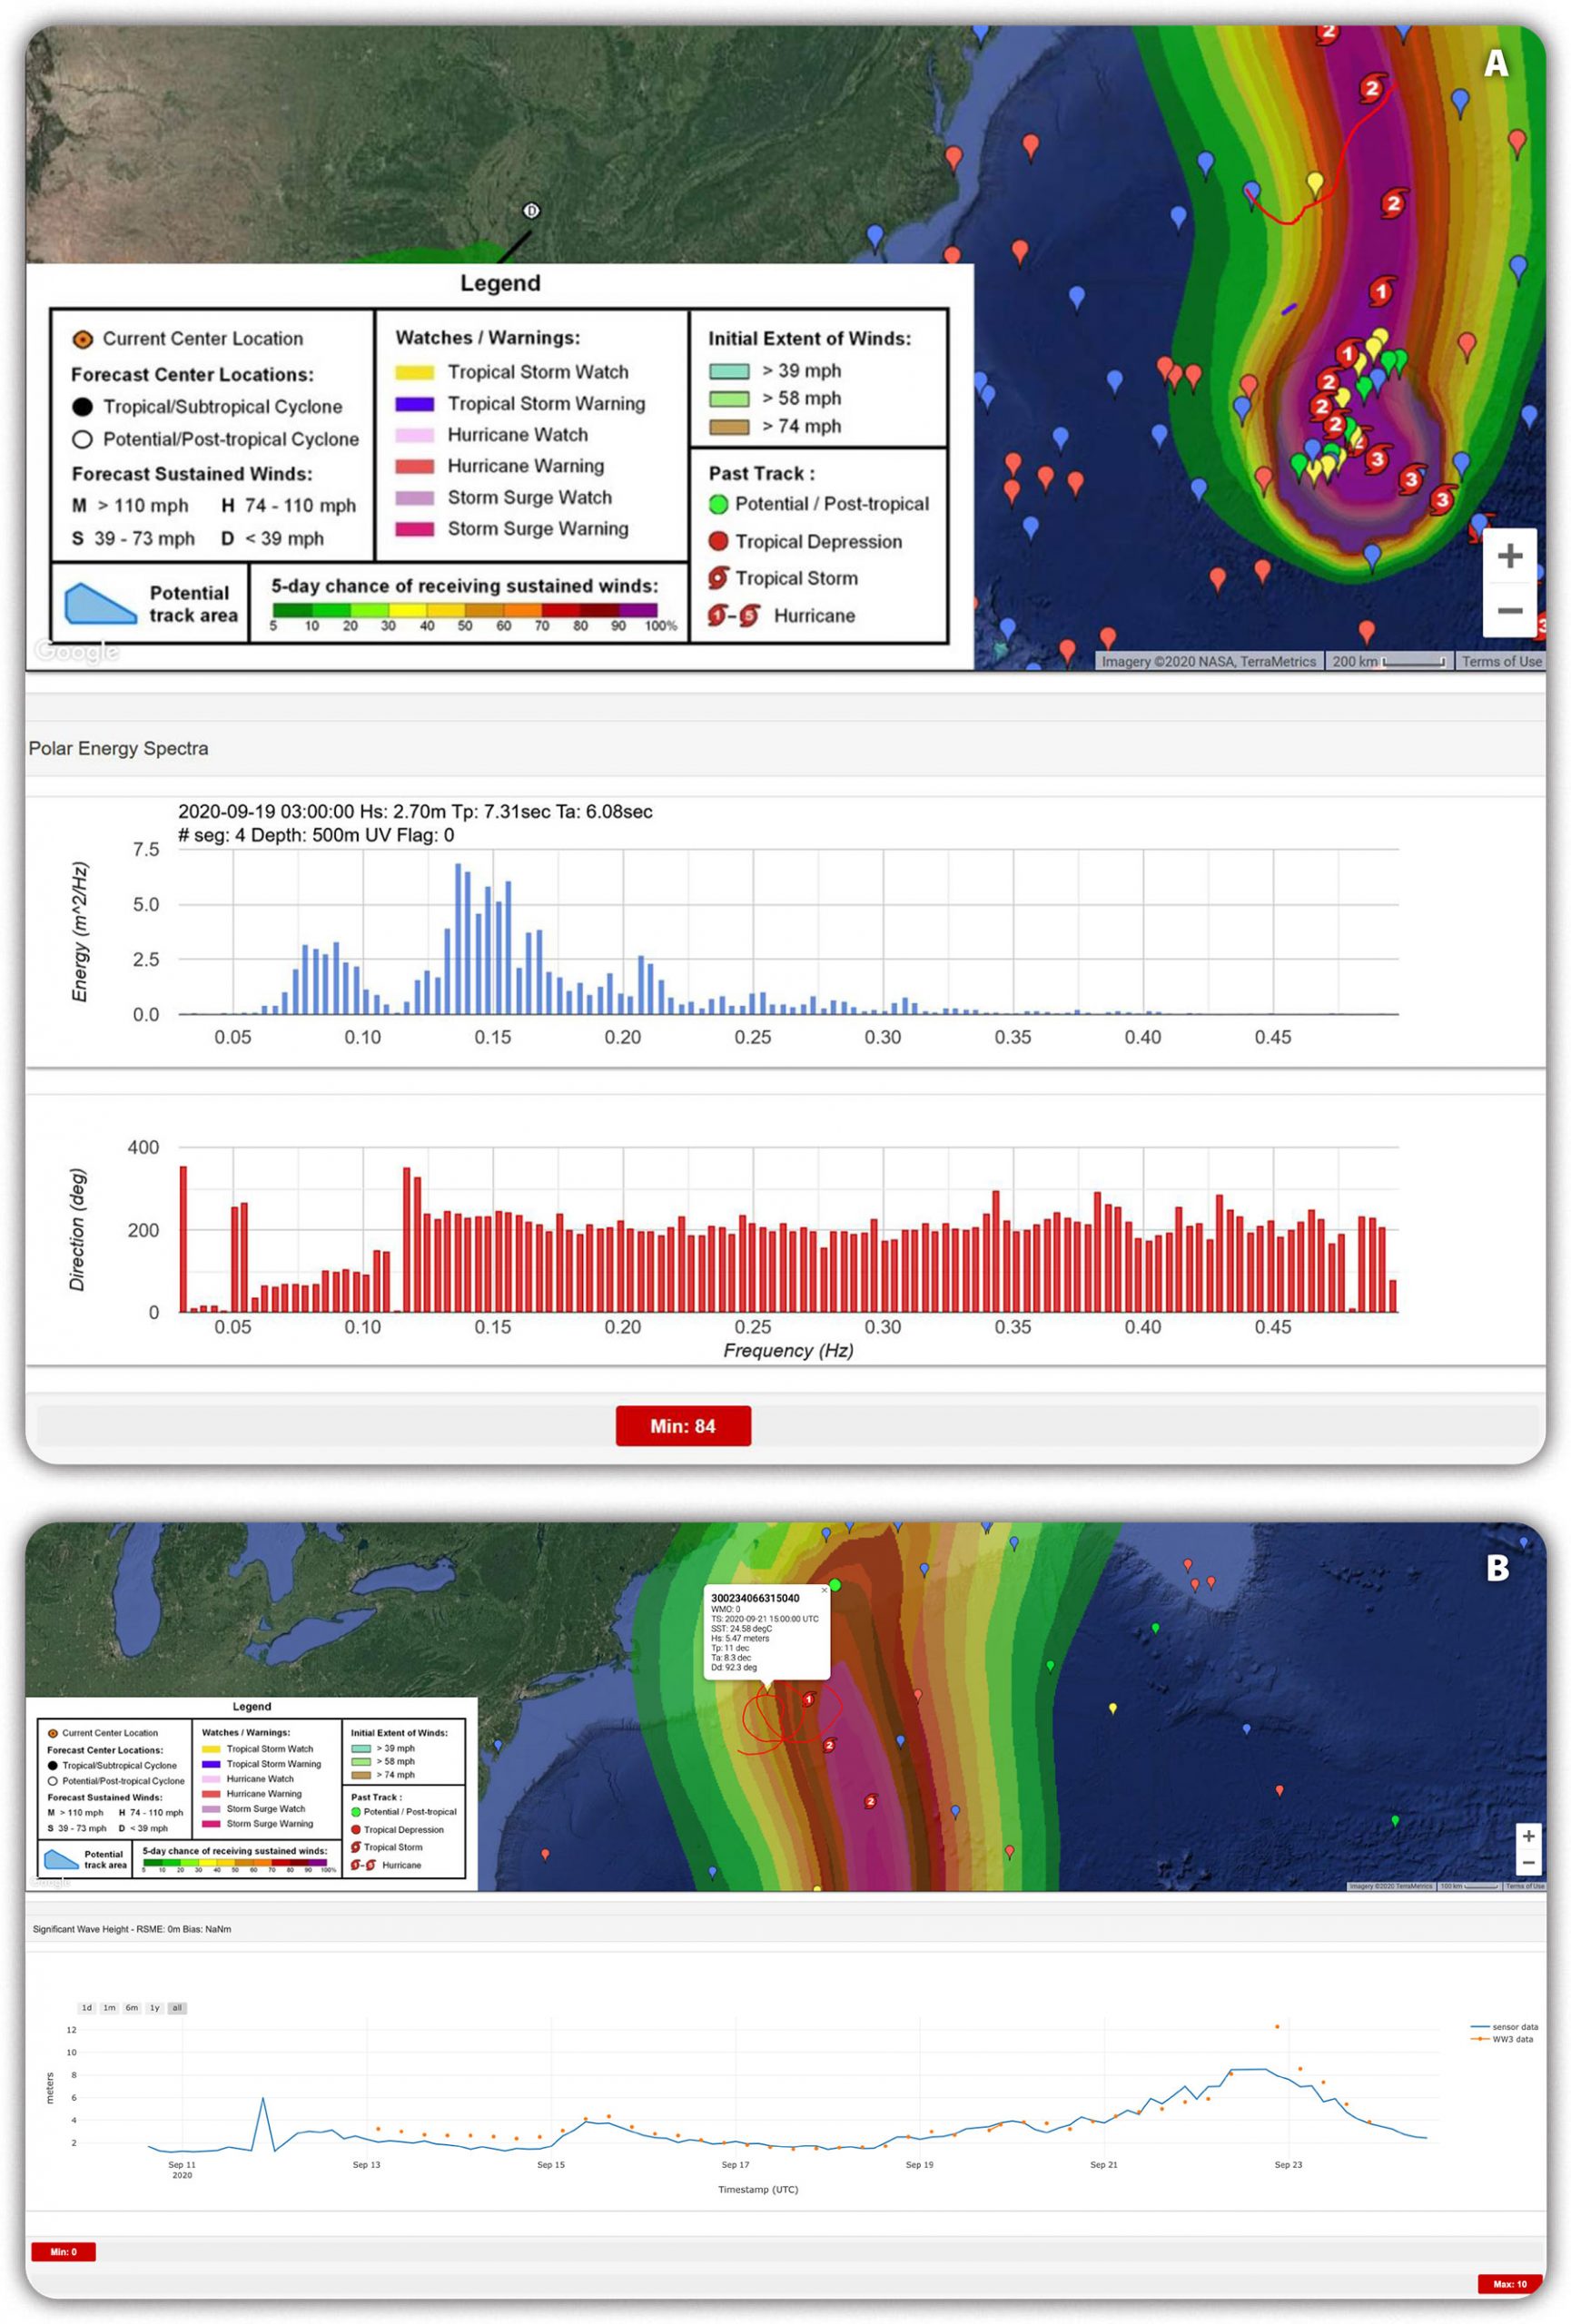
Hurricane Teddy was at times a Category 3 hurricane and was expected to produce large waves along the US northeast coast and Canada. The goal of this research project was to measure the ocean-atmosphere interface to support research on forecasting and air-wave-ocean interactions under extremely strong forcing. Drifters also transmitted the data back to shore in real time; the data were made available to the operational forecasting community through the Global Telecommunication System. As Hurricane Teddy moved rapidly northward, the array’s wave drifters measured the evolution of the seas along the storm track. Wave-measuring drifters deployed off the South Carolina coast ahead of Hurricane Isaias (Figure 2) had been moved north by currents and also measured the waves as both Hurricane Paulette and Hurricane Teddy moved northward (Figure 1).
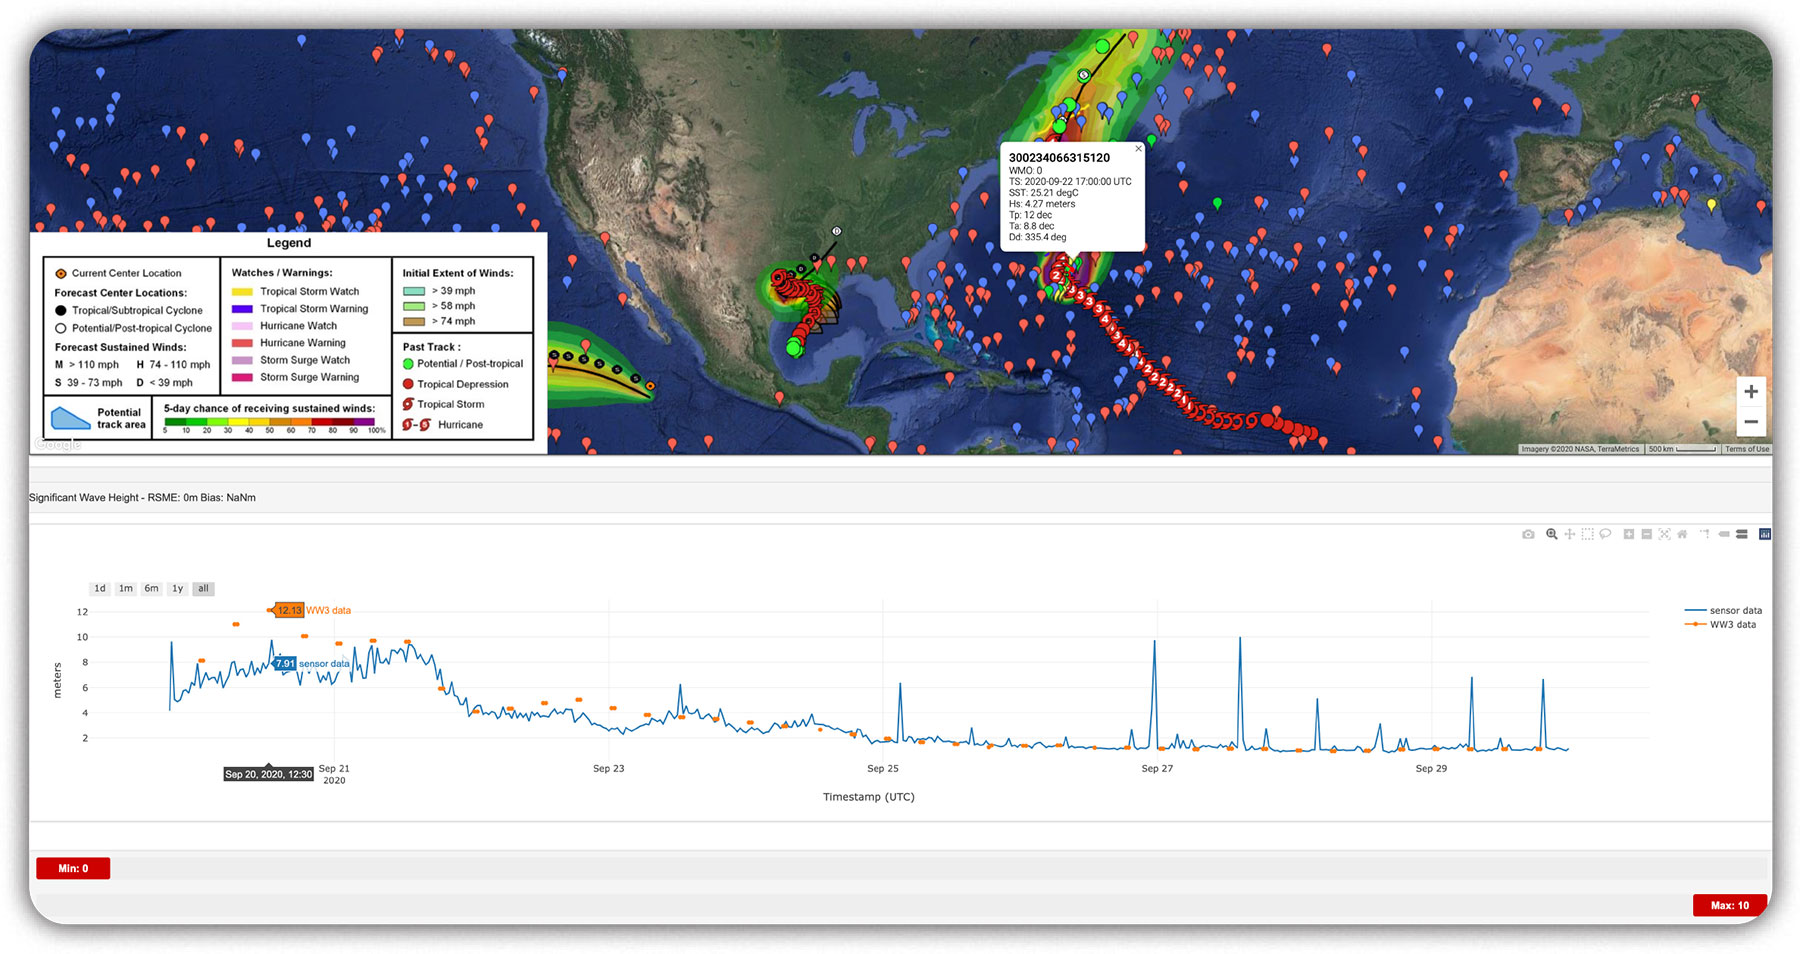
Given the relative position of the paths of Paulette and Teddy, it was not surprising that the wave field was dominated by 10–15 seconds swell moving eastward. Along the New England coast, peaks of up to 8–10 meters in significant wave height from Paulette’s passing and then Teddy’s track northward were observed. Along the core of the storm, there appears to be mainly swell with brief periods of wind wave-dominated seas. An early interpretation is that the rapid forward northward movement of the storm did not provide enough time for larger swell to build as models forecasted (see Figure 3).
Early comparisons of drifter measurements to model calculations show that the WaveWatch 3 and other models overestimated the wave heights. Collaborations between GDP scientists and ocean wave modelers are planned to understand the dynamics of this atmosphere-wave-ocean interaction and utilize this knowledge to improve future forecasts.
Figure 1. (A) Tracks of Hurricane Paulette and Teddy. (B) Drifters dropped in front of Hurricane Teddy measured the sea surface temperature (SST), three-dimensional wave spectra and wave height, and wind and sea level pressure (SLP) along Teddy’s path northward. Note the yellow dots are wave drifters, blue dots measure SST and SLP, and green dots measure SST, SLP, and wind. (C) Drifters dropped in front of Hurricane Isaias have moved to the waters offshore of New England and measured the wave field (yellow dots) as the storm moved past.
Figure 2. (A) Spectra from wave drifter deployed in Hurricane Isaias, now off the New England coast, show the separation of wind seas and swell (potentially from Hurricane Paulette). (B) The significant wave height from the drifter shows the increase in swell from Hurricane Teddy and the mismatch with the WaveWatch III model prediction at the height of the storm passage.


